
Now that the Canadian Dental Care Plan (CDCP) has been in place for about a year, both patients and dentists have had time to form opinions on how the program is working. Among CDCP patients surveyed, 95% expressed an overall positive view of the plan. Despite ongoing discussions between the dental profession and the federal government regarding the CDCP, it’s reassuring to know that patients using the program appreciate it.
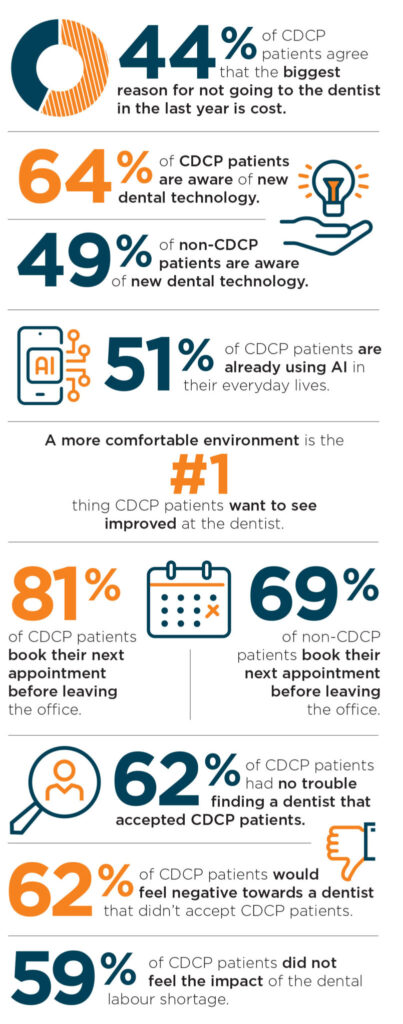
Let’s take a closer look at your CDCP patients. Our findings show that they are more aware of new dental technologies, such as AI, compared to non-CDCP patients. Their interest in dentistry aligns with their proactive approach to improving their oral health by enrolling in the plan.
When asked about the importance of eco-friendly dental practices, 48% of CDCP patients said they would be more likely to visit a sustainable practice, compared to 27% of non-CDCP patients. Additionally, 55% of CDCP patients expressed openness to visiting clinics run by independent dental hygienists, whereas only 37% of non-CDCP patients would consider it.
If you would like to share your experience with the Canadian Dental Care Plan and how patients have responded to it, please feel free to email our Managing Editor, Marley Gieseler: marley@newcom.ca.
As seen in the print issue of Oral Health April 2025
In 2024 Bramm Research, a third-party independent research house, conducted a confidential online survey of general population Canadians who have visited a dentist within the past two years. The survey was limited to those 25 years or older, and nine age brackets were filled proportionally to the Canadian general population. Provincial proportions were also filled to proportionally represent English speakers in Canada of age 25 or higher. The target sample for gender was 50% female and 50% male. The survey launched on Friday, September 20th and closed on Thursday, October 3rd for a total of 14 days in field, and the number of completed responses was 1,000, the same as in 2019. With a total sample of 1,000, the margin of error is plus or minus 3.1 percentage points at the 95 percent confidence level. If, for example, 50% of the sample indicated that agreed with a statement, then we can be reasonably sure (19 times out of 20) of an accuracy within +/- 3.1%. This means that a total census would reveal an answer of not less than 46.9% and not more than 53.1%.
Sponsored by